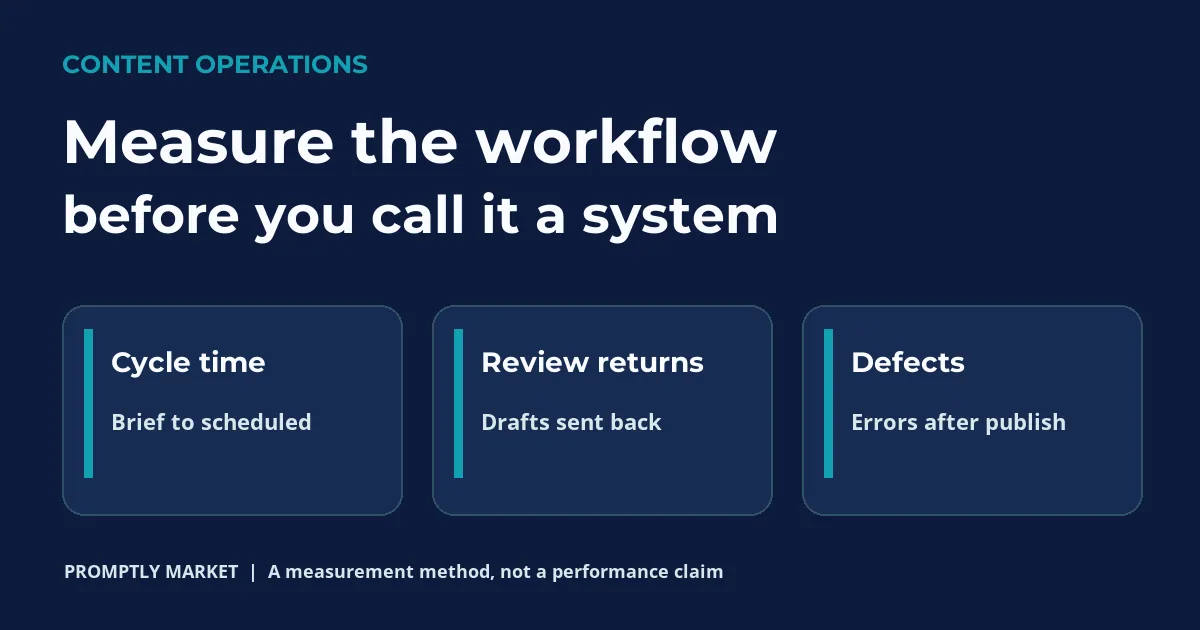
Answer first: measure a content operating system by what happens between an accepted brief and a correct publication. Track cycle time, review returns and publication defects for each piece, then read those measures alongside reader outcomes. Faster output with worse work is not an improvement.
A calendar can tell you that four articles shipped. It cannot tell you why the fourth took twice as long as the first, how many drafts came back for missing evidence, or whether readers found broken links. Those are operating questions. If you are new to the system, begin with the four-layer marketing operating-system guide; this article shows how to see whether a documented content workflow is working.
Define the unit before you collect a number
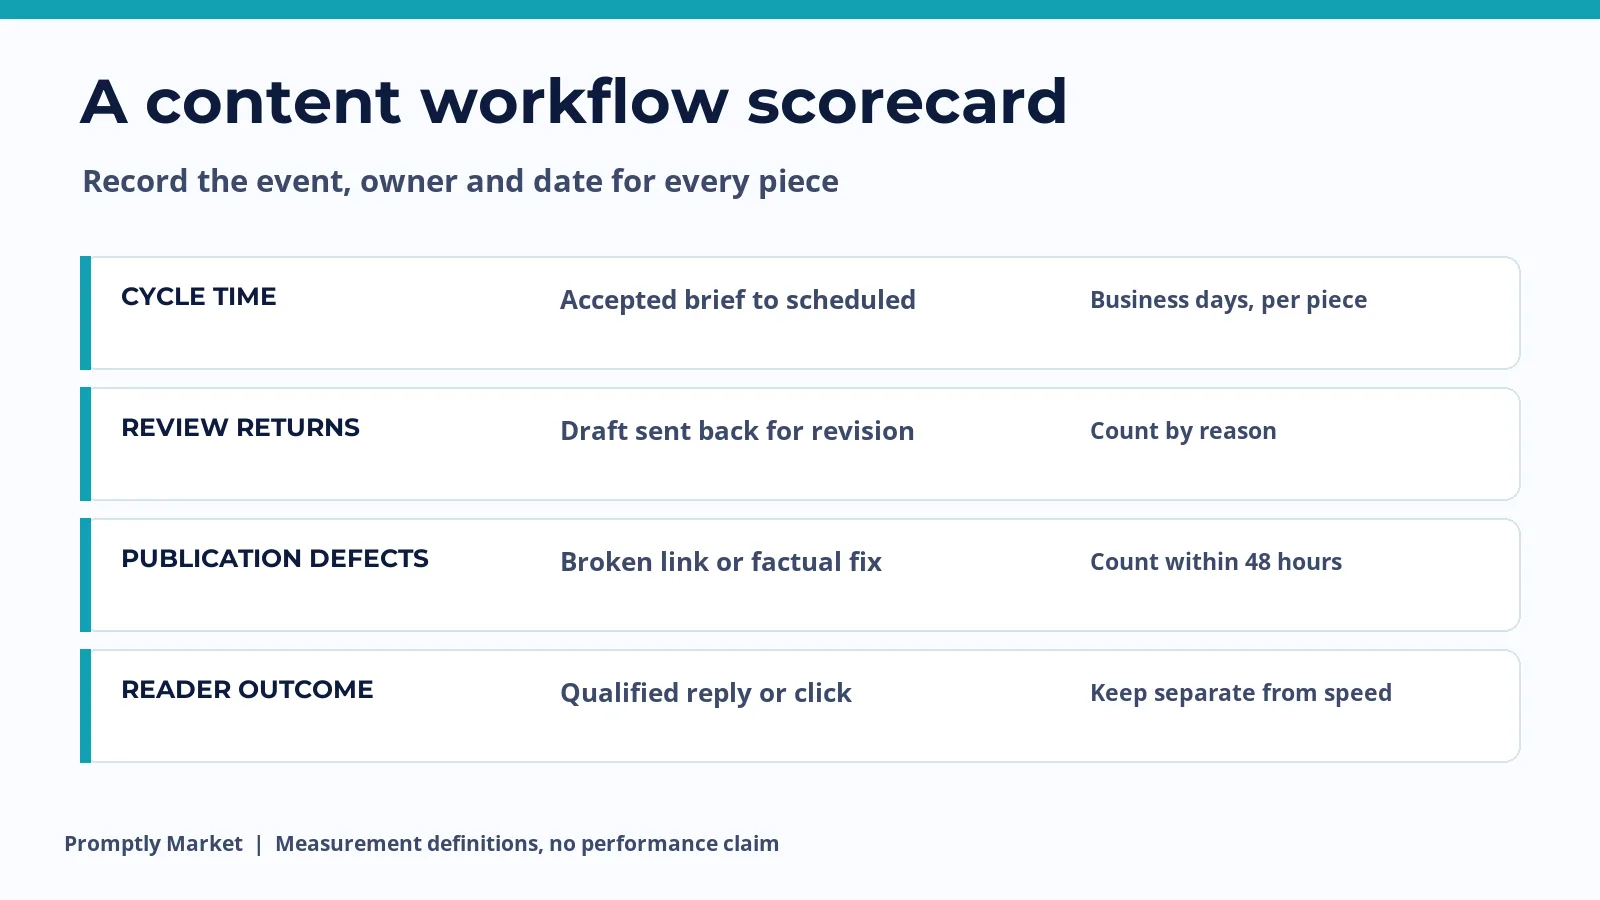
Use one row per content item. The start event is the time a brief is accepted as ready to draft. The end event is when that item is scheduled with final copy, asset and link. This deliberately excludes an idea sitting in a backlog and separates production time from publication lead time. Record the actual dates and the owner. If an item is abandoned, mark it abandoned rather than hiding it from the denominator.
Four measures that answer different questions
1. Cycle time: how long does the work take?
Definition: business days from accepted brief to scheduled publication. Use the median as your default summary because one unusually complex article can distort the mean. Keep format and complexity visible: a 500-word announcement and a researched comparison should not share an unexplained average. If the brief is returned because the topic was unclear, log that separately as a brief defect.
2. Review returns: how much work comes back?
Definition: count every time a reviewer returns a draft for material revision. Tag the reason, such as unsupported claim, weak angle, missing customer evidence or formatting. A higher count can mean a better gate is catching problems, so read it with defect rate. The important question is whether the same preventable reason recurs after the brief or template changes.
3. Publication defects: what escaped?
Definition: count corrections within 48 hours of publication for broken destination links, inaccurate factual claims, missing alt text, wrong account or incorrect assets. Record the defect, its severity and the fix. A typo and a false claim should not be treated as equally costly. This is where the Content Gate becomes testable rather than ceremonial.
4. Reader outcome: did the piece help?
Use a real outcome linked to the content’s purpose: qualified search clicks, a useful reply, a relevant signup or a demo conversation. Keep it separate from workflow speed. A team can halve production time and still miss the reader’s problem. Compare topics and channels with the marketing metrics guide before crediting the process for audience change.
A worked before-and-after example
Every number in this section is illustrative. Imagine a small B2B team that writes four articles before documenting its brief, review owner and publish gate, then four after. The example shows the arithmetic and the questions to ask. It is not a reported company result or a causal test.
| Illustrative four-piece batch | Before | After | What to inspect |
|---|---|---|---|
| Cycle time, business days per item | 12, 15, 10, 19 | 9, 7, 8, 8 | Median: 13.5 versus 8 |
| Material review returns | 3, 2, 4, 3 | 1, 1, 0, 1 | Total: 12 versus 3; which reasons vanished? |
| Defects within 48 hours | 2 across four items | 0 across four items | Were checks moved earlier, or was the second batch easier? |
| Qualified reader response | Not recorded | Recorded per item | Do not claim business lift without a comparable baseline |
The cycle-time median in this fictional sample falls from 13.5 to 8 business days, and returns fall from 12 to 3. That is a useful diagnostic signal inside the example, not proof that the new workflow caused the change. Different topics, writers, distribution and review standards could explain part of it. The after batch also starts recording qualified response, but there is no before value, so a claim about audience impact would be invented.
What the team should change next
First, inspect every former review return. If eight of twelve came from missing source links, add a required evidence field to the brief. If the after batch has one remaining return for unclear audience fit, change the topic-selection question, not the proofreading checklist. Then run the same definitions for the next eight comparable pieces. Keep the raw rows: an average without the dates and reasons cannot tell anyone what to fix.
Second, choose a publishing gate with named ownership. A writer checks claims and source links; an editor checks structure, alt text, internal links and destination URLs; the publishing owner verifies the live page. The handoff card and four-week build are in the operating-system example. If a task changes hands without an accepted brief, start the cycle clock only after the brief becomes usable, while logging the delay separately. That distinction prevents teams from hiding a briefing problem inside a writing-speed metric.
Third, avoid optimizing a single number. If cycle time falls but correction severity rises, pause the speed push. If returns rise while defects fall, the gate may be doing valuable work. If both improve but no qualified reader responds, inspect intent, distribution and the offer. The system exists to produce useful, correct work reliably, not a pretty dashboard.
A copyable row for your next content item
Item ID | audience problem | format | brief accepted date | draft owner | review owner | first review date | return count and reason | scheduled date | 48-hour defect count and severity | qualified response | next change. A spreadsheet is enough. Enter the row at each handoff, not at the end of the month from memory.
Start with the free marketing operating-system starter kit if you need the brief and gate before measuring them. Use this scorecard for the next eight pieces, then change one workflow rule based on the recurring failure you can actually see.
Frequently asked questions
What is a good content production cycle time?
There is no universal number. Define the start and end events, group similar formats, and compare your own process over time. A researched comparison and a short announcement should not be judged by the same unexplained target.
Can fewer review returns mean lower quality?
Yes. A weak review gate can make returns fall while defects rise. Track both, including the severity of corrections after publication.
How many pieces are needed before changing the process?
A repeated concrete failure can justify fixing a checklist immediately. Use a larger run of comparable items before claiming the overall workflow improved. The eight-piece example here is a teaching device, not a statistical threshold.