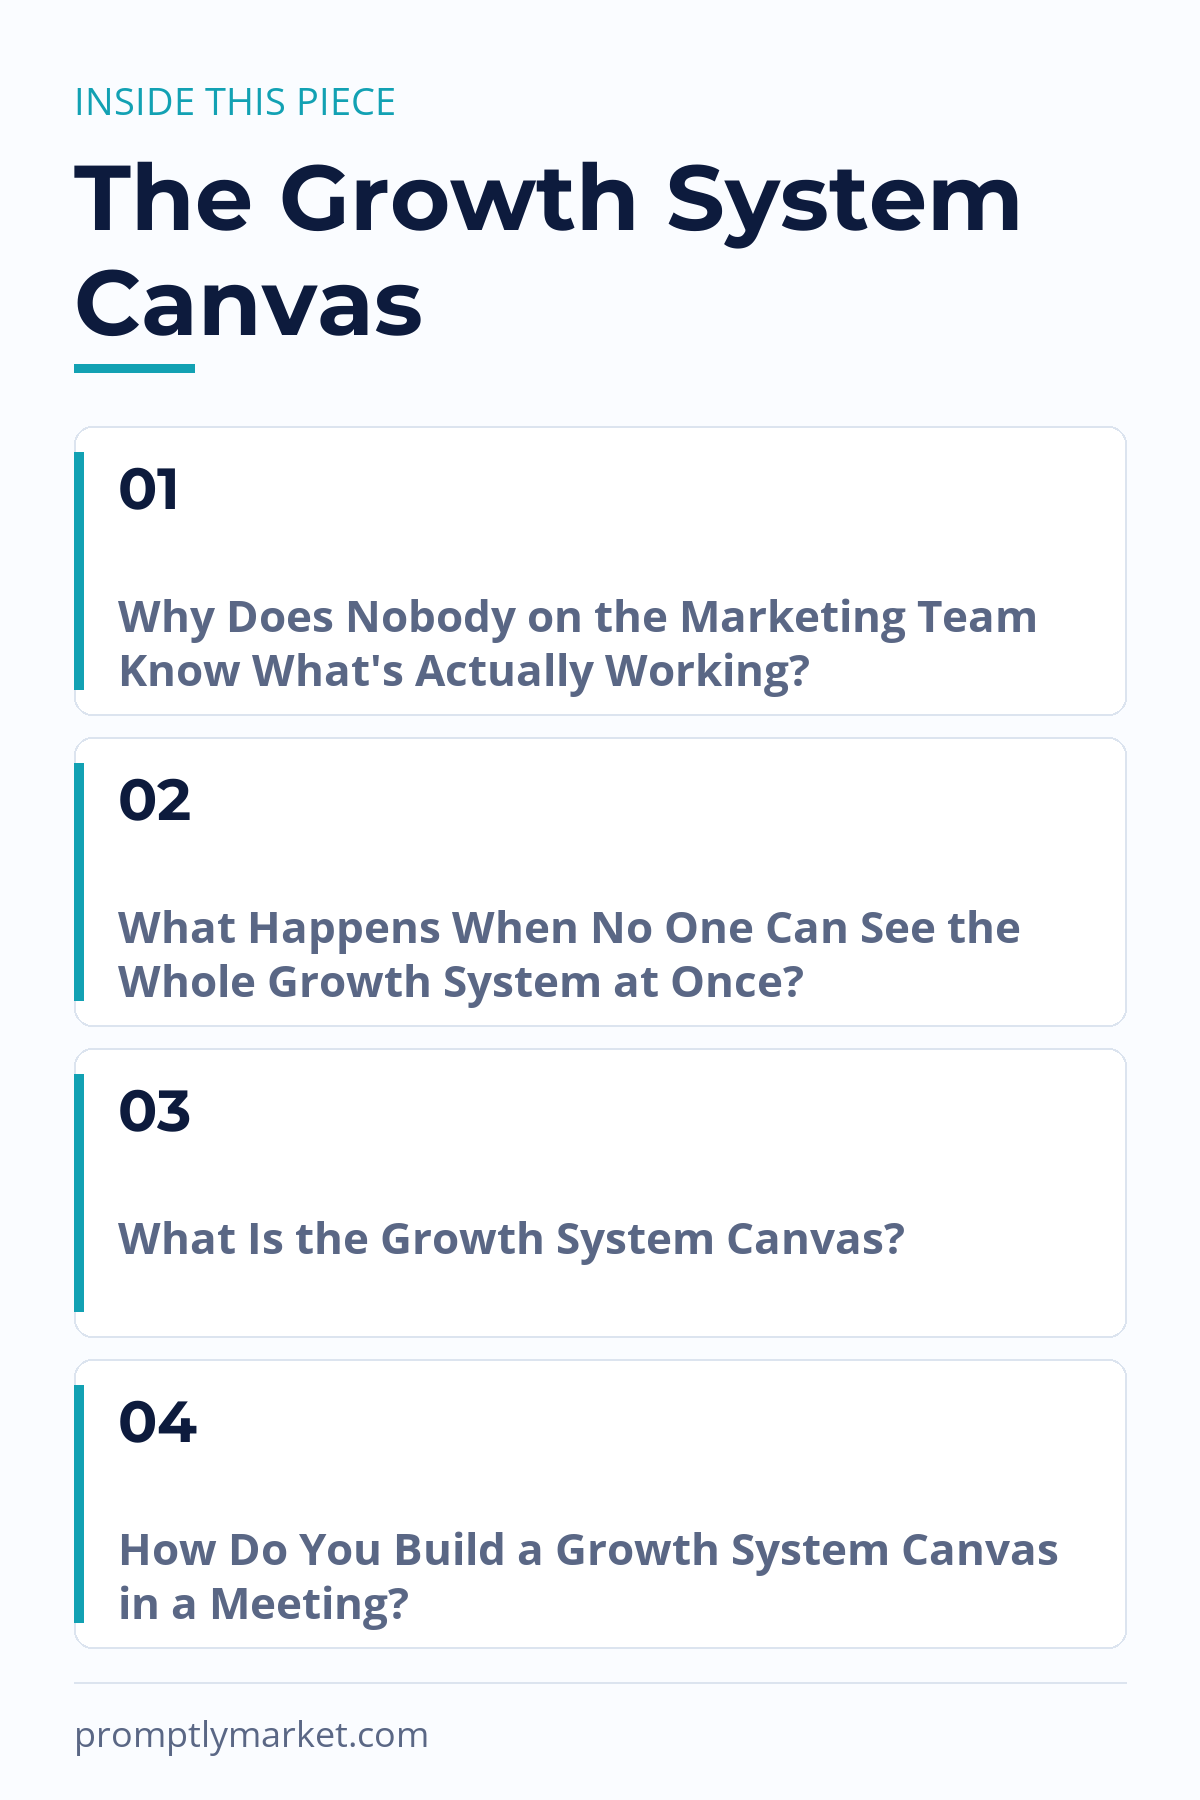
Why Does Nobody on the Marketing Team Know What’s Actually Working?
Ask five people on a marketing team to draw the growth funnel from memory, and you will get five different diagrams. The paid media person draws a funnel that starts with ad spend. The content person draws one that starts with a blog post. The sales-adjacent marketer draws something closer to a pipeline than a funnel. Nobody is wrong. They are each looking at their own spreadsheet.
This is not a discipline problem. It is a visibility problem. Most growth systems are not actually systems, they are a collection of channel-specific dashboards, a quarterly deck that gets built for a kickoff meeting and never opened again, and a shared understanding that lives mostly in the head of whoever has been at the company the longest. When that person is in a meeting or on leave, the system effectively does not exist anywhere a new hire, an agency partner, or a manager under pressure to report numbers upward could actually see it.
The Growth System Canvas exists to fix that specific problem: not a lack of tracking, but a lack of a shared, single-page view of the whole system.
What Happens When No One Can See the Whole Growth System at Once?
When a growth system only exists in fragments, three things tend to happen, usually in this order.
The easiest-to-measure part gets over-optimized. Paid channels get attention because they have clean dashboards and real-time numbers. A team can spend weeks shaving cost-per-click by a few percentage points because the data is right there, satisfying to watch move. Meanwhile a much bigger leak, say, a consideration-stage email sequence with no clear next step, or a retention stage nobody has assigned a metric to, sits untouched, not because it doesn’t matter, but because it doesn’t show up on the dashboard anyone is already looking at.
Ownership gaps become invisible. In most teams, every channel and every funnel stage should have an owner and a metric that proves it is doing its job. In practice, gaps are common: a channel that generates real attention but that nobody is formally responsible for, or a funnel stage, often consideration or retention, where the team assumes “someone” is watching it, and it turns out no one is. These gaps don’t announce themselves. They just quietly stop contributing, and nobody notices until growth stalls and there’s no clear answer as to why.
Planning meetings become archaeology. Without a shared view, quarterly or monthly planning turns into a reconstruction exercise, pulling screenshots from five tools, cross-referencing spend reports, and trying to remember what was tried last quarter and why it was dropped. Industry surveys on marketing operations consistently point to reporting and cross-tool reconciliation as one of the biggest time sinks for marketing teams, and this fragmentation is a large part of why: the system was never captured in a form that survives past the meeting it was built for.
None of this is caused by a bad tool or a lazy team. It’s caused by the absence of a single artifact that forces the whole system to be visible in one place, at one time, to everyone in the room.
What Is the Growth System Canvas?
The Growth System Canvas is a one-page way to see an entire growth engine at once: channels, offers, funnel stages, and the one metric that proves each part is working. It is not a new piece of software and it is not a replacement for analytics tools. It is a shared thinking surface, something a team fills in together, in a room or on a shared doc, so the whole system becomes visible instead of scattered across five spreadsheets and a deck nobody opens after the kickoff meeting.
The Canvas is built from four blocks, repeated for each meaningful piece of the growth system.
Block One: Channels, Where Does Attention Actually Come From?
This block lists every place a person first notices the brand or the offer: organic search, a specific social platform, referrals, paid ads, partnerships, word of mouth, existing customers, and so on. The discipline here is specificity. “Social media” is not a channel; “LinkedIn organic posts from the founder” is a channel. The more specific the entry, the easier it becomes to assign ownership and a metric to it later.
Block Two: Offer/Hook, What Makes Someone Stop and Engage?
Every channel entry needs a paired hook: the specific thing that gets someone to stop scrolling, click, or reply. This could be a piece of content, a lead magnet, a discount, a demo invite, or simply a well-framed idea in a post. Teams often discover in this step that a channel is active but has no real hook attached to it, traffic or attention is arriving, but nothing is actually asking for the next step.
Block Three: Funnel Stage, Where Does This Piece of the System Sit?
Every channel-and-hook pair gets tagged to a stage: awareness, consideration, conversion, or retention. This is the step that turns a flat list of tactics into a system. It’s also usually where the first real gap shows up, most teams have plenty of awareness-stage entries and conversion-stage entries, and noticeably fewer for consideration and almost none for retention.
Block Four: The One Metric, How Do You Know This Block Is Working?
Each entry gets exactly one metric, not a dashboard full of metrics, just one number that would tell you, at a glance, whether this specific block of the system is pulling its weight. For an awareness-stage LinkedIn post, that might be follows or profile visits, not likes. For a consideration-stage email sequence, it might be reply rate, not open rate. For a retention-stage onboarding flow, it might be week-four activation, not signups. Forcing a single metric per block is uncomfortable at first, because it means giving up vanity numbers that feel productive but don’t actually prove anything.
How Do You Build a Growth System Canvas in a Meeting?
The Canvas works best built live, with the whole marketing team in the room, rather than assembled by one person afterward and shared as a document.
- Start with channels, not stages. List every channel currently in use, even minor or experimental ones. Resist the urge to prioritize yet, this is an inventory, not a plan.
- Attach a hook to each channel. For every channel, write down what specifically is asking the audience to engage right now. If the honest answer is “nothing, really,” write that down too. That’s useful information, not a failure.
- Tag each pair to a funnel stage. Awareness, consideration, conversion, or retention. Some pairs will span two stages, that’s fine, tag the primary one.
- Assign one metric per pair. Push back on anything that sounds like a dashboard (“engagement metrics”) rather than a single number (“reply rate on the LinkedIn DM sequence”).
- Name an owner for each row. A row without an owner is the clearest early warning sign the Canvas can surface, write “unassigned” if that’s the truth, rather than leaving it blank.
The whole exercise typically takes one working session, not a quarter of planning cycles. The output should genuinely fit on one page or one screen, if it doesn’t, the team is probably tracking too many low-value channels rather than too few.
How Do You Use the Canvas to Find the Weakest Link in a Growth System?
Once the Canvas is filled in, the real value shows up in what it makes obvious. Three patterns are worth scanning for immediately.
Look for the stage with no metric, or no entry at all. If awareness and conversion are full of rows but consideration has one entry and retention has none, that is very likely where growth is leaking, not because those stages are being actively mismanaged, but because they were never made visible enough to manage at all.
Look for the channel nobody owns. A channel that is generating attention but has “unassigned” or a vague team name in the owner column is a channel that will underperform indefinitely, regardless of how good the underlying idea is. Attention without an owner tends to decay.
Look for metric duplication. If three different rows are all using the same easy-to-pull metric (say, impressions), that’s usually a sign the team defaulted to what was easiest to report rather than what actually proves the block is working. This is exactly the over-optimization pattern the Canvas is designed to expose.
The goal is not to fix everything the Canvas reveals in one sitting. It’s to stop the team from continuing to polish the parts that are easy to measure while a genuinely weak link, an unowned channel, an untracked stage, quietly caps how much the whole system can grow. Once the weakest link is visible, prioritizing it becomes a much simpler conversation, because the team is finally looking at the same page instead of five different ones.
Where Does the Growth System Canvas Fit Alongside Existing Tools?
The Canvas is not meant to replace analytics platforms, CRMs, or channel-specific dashboards, those still hold the real numbers. What the Canvas replaces is the missing summary layer above all of them: the single page that says, in plain language, what the whole system looks like right now, who owns which part of it, and which parts have no proof they’re working at all. Teams that keep the Canvas alive, revisiting it monthly rather than building it once and filing it away, tend to catch gaps early, before a quarter’s worth of budget has gone toward the easy-to-measure channel while a real leak went unaddressed.
Frequently Asked Questions About the Growth System Canvas
What is the Growth System Canvas used for?
It’s used to give a marketing team a single, shared, one-page view of their entire growth engine, every channel, the hook attached to it, which funnel stage it belongs to, and the one metric that proves it’s working. It’s built to replace the scattered-spreadsheets-and-forgotten-deck version of growth planning that most teams default to.
How is the Growth System Canvas different from a marketing funnel diagram?
A typical funnel diagram shows stages in the abstract, awareness, consideration, conversion, without necessarily connecting them to specific channels, specific hooks, or a specific owner and metric for each. The Canvas forces every stage to be filled in with real, current tactics and a named owner, so gaps become visible instead of theoretical.
Who should be in the room when a team builds this Canvas?
Ideally, whoever owns each channel or function, content, paid, lifecycle/retention, and anyone close to sales or customer success. The Canvas is most useful when it’s built together in one sitting, since the gaps it reveals (an unowned channel, an untracked stage) are usually invisible to any single person working alone.
How often should a team update the Growth System Canvas?
Monthly is a reasonable rhythm for most teams, frequent enough to catch a new gap before it becomes a quarter-long blind spot, but not so frequent that it turns into another dashboard to maintain. Some teams revisit it at the start of every planning cycle instead, which works too, as long as it’s a fixed habit rather than a one-time exercise.
What’s the biggest mistake teams make when filling out the Canvas?
Assigning a metric that’s easy to pull rather than one that actually proves the block is working, impressions instead of reply rate, signups instead of activation. The Canvas only does its job if each metric genuinely answers “is this block working,” even when that number is harder to get to than the obvious one.
One marketing system a week, in plain language.
No fluff, no tool reviews, no hype. Just the frameworks and checklists behind the posts, sent as they are published. Free, and you can leave any time.